Dashainko Dakshina: 18% OFF on All Courses!

Power BI Training
Power BI Training Institute in Kathmandu, Nepal




Thousands of students have started their careers after getting certified by Broadway Infosys
Updated On: 19/07/2026
Created On: 21/07/2022
Course Overview
Power BI is a technology-driven business intelligence collection of tools that connects disparate data sets, manages all facets of a company, and provides visuals of the data. The course focuses on building an interactive dashboard for analyzing data and extracting business insights from multiple unrelated sources. By connecting to one or more of the hundreds of existing data sources and using a secure, easy-to-understand interface, one can quickly and simply interact with and understand the data to influence all business systems.
We offer one of the top business intelligence and data analytics platforms that target finding insights within an organization’s data.
Broadway offers Power BI training in Nepal to help aspiring Business Intelligence Developers and Analysts navigate and create BI tools along with complete knowledge of the BI system. Today, there is high demand for Power BI-certified professionals in the market; therefore, this is a valuable skill to have for long-term career growth.
Tools Covered
Some of the major industry-relevant tools you'll work with in this course include:
-
Microsoft Power BI
-
SQL Server
-
DAX
-
Power Query
-
Excel
What Our Students Say About Power BI Training

Mr. Jhalak Poudel
SPSS Training
I am happy with both teacher and Broadway Infosys in Nepal. In the past, I also undertook an SPSS course with this institution, that is why I have chosen it again this time. Drawing from the experiences of both these...
Students who got hired learning with us
Hear from graduates who have completed our courses.
College/Faculty: Khowpa College of Engineering / Computer Engineering
Working At: VIVO Nepal
Position: Market Analyst
College/Faculty: Islington College / Bsc. Computing
Working At: Supreme IT Solutions Pvt. Ltd.
Position: React Developer
College/Faculty: Orchid International College / BSc. CSIT
Working At: Bhetayo Inc. Pvt. Ltd. (Panchakanya Group)
Position: Senior Assistant Digital Marketing
College/Faculty: Ace Institute of Management / Management
Working At: JO Marketing
Position: SEO Intern
Our graduates are hired by 470+ companies in Nepal
Time for you to be the next hire. With our advanced and industry relevant courses, you are on the right stage to start your dream career.

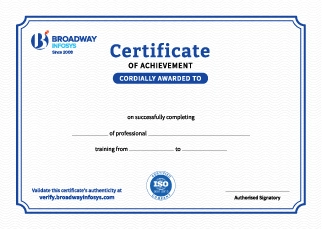
Earn a High Value Industry Certificate
Add this credential to your LinkedIn profile, resume, or CV to stand out to recruiters.
Already earned a certificate?
Verify it here
Frequently Asked Questions
No prior Power BI experience is required. A basic understanding of Excel, data, and general computer skills is helpful, allowing beginners and working professionals to follow the training comfortably.
Yes. The training starts with Power BI basics and gradually moves into data transformation, data modeling, DAX, interactive dashboards, and advanced analytics.
You will learn how to import, clean, transform, model, analyze, and visualize data using Power BI and create interactive reports and dashboards for business decision-making.
Yes. You will learn Power Query to clean, transform, combine, and prepare data from different sources before analysis.
Yes. You will learn DAX (Data Analysis Expressions) for creating calculated columns, measures, KPIs, and advanced calculations for data analysis.
Yes. You will learn to create professional and interactive dashboards using charts, slicers, filters, KPIs, drill-throughs, and other visualization features.
Yes. You will learn how Power BI can connect to sources such as Excel, CSV, databases, web data, and other supported data sources for reporting and analysis.
Yes. You will learn how to build effective data models, relationships, calculated measures, and data structures to support accurate and efficient reporting.
Yes. You will explore relevant AI-powered features in Power BI that can assist with data analysis, identifying patterns, generating insights, and making reports more intelligent.
Yes. You will learn how to turn raw data into meaningful insights, KPIs, trends, and visual reports that can support data-driven business decisions.
Yes. The training emphasizes hands-on learning through practical datasets, reporting exercises, dashboard development, and real-world business scenarios.
You will be able to connect and transform data, build data models, write DAX measures, create interactive dashboards, analyze business data, and present actionable insights using Power BI.
The training can help you prepare for roles such as Power BI Developer, Business Intelligence Analyst, Data Analyst, Reporting Analyst, BI Consultant, and other data-related positions.
You’ll receive hands-on guidance from trainers throughout the course, including support with Power Query, DAX, data modeling, dashboard creation, practical exercises, and projects.
Yes. Depending on your requirements, you can discuss suitable schedules with the training team. One-to-one training and group-based learning options may also be available.
Our course is available in hybrid training mode. You can attend classes in person or join online, whichever works best for you. If you cannot attend in person on a particular day, you can simply join the class online instead.
The course pricing varies depending on the subject and level. For detailed information on the course price, please contact us directly: +977-9841002000 / +977-1-4111849. Our team will be happy to guide you or send us an email at [email protected].
Our syllabus outlines are only the headlines of the major modules. To ensure a complete understanding of the course, we offer free counseling. Also, if you have specific modules in mind, you can customize the course. Send your inquiry today!
Lesson 1: Course Content Power BI Training
Basic to SQL
- Introduction to Database
- Database Designing Process
- Configuring SQL Server Log and Data Files.
- Data Types
- Creating Tables
- Accessing and Modifying Database and Tables(DML)
- Implementing Data Integrity
- Creating Indexes
- Accessing and Modifying Data
- Join and Sub Queries
- Implementing Views
- Business intelligence concepts
- Data warehousing
- Basic ETL Proces
- Analytics
- Reporting
Lesson 2: Microsoft Power BI Data Analyst (45 Hours)
- Identify and connect to a data source
- Change data source settings, including credentials, privacy levels, and data source locations
- Select a shared dataset, or create a local dataset
- Choose between DirectQuery, Import, and Dual mode
- Change the value in a parameter
- Evaluate data, including data statistics and column properties
- Resolve inconsistencies, unexpected or null values, and data quality issues
- Resolve data import errors
- Select appropriate column data types
- Create and transform columns
- Transform a query
- Design a star schema that contains facts and dimensions
- Identify when to use reference or duplicate queries and the resulting impact
- Merge and append queries
- Identify and create appropriate keys for relationships
- Configure data loading for queries
- Configure table and column properties
- Implement role-playing dimensions
- Define a relationship's cardinality and cross-filter direction
- Create a common date table
- Implement row-level security roles
- Create single aggregation measures
- Use CALCULATE to manipulate filters
- Implement time intelligence measures
- Identify implicit measures and replace with explicit measures
- Use basic statistical functions
- Create semi-additive measures
- Create a measure by using quick measures
- Create calculated tables
- Improve performance by identifying and removing unnecessary rows and columns
- Identify poorly performing measures, relationships, and visuals by using Performance Analyzer
- Improve performance by choosing optimal data types
- Improve performance by summarizing data
- Identify and implement appropriate visualizations
- Format and configure visualizations
- Use a custom visual
- Apply and customize a theme
- Configure conditional formatting
- Apply slicing and filtering
- Configure the report page
- Use the Analyze in Excel feature
- Choose when to use a paginated report
- Configure bookmarks
- Create custom tooltips
- Edit and configure interactions between visuals
- Configure navigation for a report
- Apply sorting
- Configure sync slicers
- Group and layer visuals by using the Selection pane
- Drill down into data using interactive visuals
- Configure export of report content, and perform an export
- Design reports for mobile devices
- Incorporate the Q&A feature in a report
- Create and configure a workspace
- Assign workspace roles
- Configure and update a workspace app
- Publish, import, or update assets in a workspace
- Create dashboards
- Choose a distribution method
- Apply sensitivity labels to workspace content
- Configure subscriptions and data alerts
- Promote or certify Power BI content
- Manage global options for files
- Identify when a gateway is required
- Configure a dataset scheduled refresh
- Configure row-level security group membership
- Provide access to datasets
After completing this course the audience will be able to attend Microsoft Certification Exam
PL-300: Microsoft Power BI Data Analyst

Advanced Excel

SQL Server Training


Stata Training in Nepal

STAAD - Pro Training

SPSS Training


Oracle Training


Upcoming Classes (7)
Why Power BI Training?
In-Demand Data Skill: Learn Power BI to turn business data into clear reports, dashboards, and insights.
Data Analysis & Visualization: Work with data from different sources and present it through interactive charts and dashboards.
Business Intelligence: Learn to use data to identify trends, measure performance, and support better business decisions.
Practical Projects: Apply Power BI skills through real-world datasets and reporting scenarios.
Career-Ready Skills: Build knowledge useful for roles in data analysis, business intelligence, reporting, and management.
Hands-On Learning: Develop practical Power BI skills through guided exercises and project-based training.
Expert Instructors: Learn from experienced Power BI professionals with strong industry knowledge.
Expert Project Support: Receive guidance and supervision from experts while working on projects.
Quick Inquiry
Choose class schedule(s)
-
27 Oct 2026
-
01 Nov 2026
-
02 Nov 2026
-
16 Nov 2026
-
22 Nov 2026
-
24 Nov 2026
-
29 Nov 2026